Checking your blood sugar is key to staying healthy. This is true for people with diabetes or anyone wanting to keep their glucose in check. Tools like continuous glucose monitors (CGMs) and blood glucose meters (BGMs) show how your body reacts to food and activity. But, it can be hard to understand these numbers, especially with different units.
A blood sugar conversion chart is a big help. It lets you switch your glucose readings from milligrams per deciliter (mg/dL) to millimoles per liter (mmol/L), or the other way around. This makes it easier to manage your blood sugar levels.
Key Takeaways
- A blood sugar conversion chart helps you interpret your glucose readings in different measurement units.
- Understanding the conversion between mg/dL and mmol/L can simplify diabetes management and improve your overall health.
- Using a conversion chart can provide a clearer picture of your blood sugar levels and assist in setting appropriate targets.
- Knowing how to convert between measurement units can enhance communication with healthcare providers and empower you to take a more active role in your care.
- Mastering the use of a blood sugar conversion chart is a valuable skill for anyone interested in optimizing their glucose control.
Understanding Blood Glucose Measurements
To manage your blood sugar well, knowing the units for measuring is key. In the U.S., we use milligrams per deciliter (mg/dL). But, many other countries prefer millimoles per liter (mmol/L).
What Are Blood Glucose Units?
The mg/dL unit shows the weight of blood glucose in a blood sample. On the other hand, mmol/L counts the glucose molecules in one liter of blood. To switch between them, remember: 1 mmol/L is the same as 18 mg/dL.
Why Different Countries Use Different Measurements
Why do countries use different units for blood glucose? It’s because of history and culture. The U.S. sticks to mg/dL, but other places use mmol/L. This is because they follow the International System of Units (SI).
The Importance of Accurate Readings
Getting accurate blood glucose readings is very important. It’s especially true if you have diabetes. Right measurements help you make better choices about food, exercise, and medicine. Using health tracking charts can also give you important insights about your health.
Blood Sugar Conversion Chart: Essential Tool for Diabetes Management
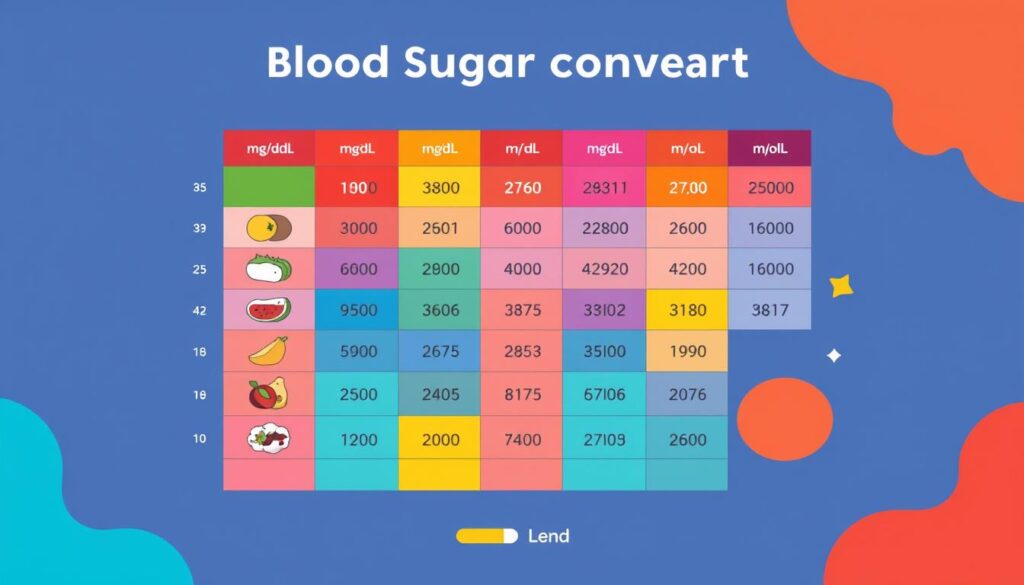
Keeping blood sugar levels healthy is key for people with diabetes. A blood sugar conversion chart is a great tool. It helps you switch between milligrams per deciliter (mg/dL) and millimoles per liter (mmol/L) easily.
This chart lets you understand your blood glucose readings right. It’s very useful when talking to doctors or traveling. This is because different places might use different units.
A detailed blood sugar conversion chart has lots of info. It includes fasting blood glucose levels, targets after meals, and A1C percentages. It gives you a full view of managing your blood sugar. This helps you make smart choices for your diabetes care.
It also has glycemic index references and carb counting resources. These help you see how foods affect your blood sugar. This way, you can choose better foods for your diet.
“A blood sugar conversion chart is a must-have for anyone with diabetes. It takes the guesswork out of interpreting your readings and helps you stay on top of your blood sugar management.”
Having a blood sugar conversion chart makes managing diabetes easier. It helps you track your blood sugar accurately. This tool is a big help in your journey to better health.
Converting Between mg/dL and mmol/L
It’s important to know how to switch between milligrams per deciliter (mg/dL) and millimoles per liter (mmol/L). These units measure glucose levels. In the U.S., mg/dL is used. But, mmol/L is more common elsewhere.
Basic Conversion Formulas
To change mg/dL to mmol/L, just multiply by 0.0555. For example, if your blood sugar is 105 mg/dL, here’s how to convert it:
105 mg/dL × 0.0555 = 5.83 mmol/L
To switch mmol/L to mg/dL, multiply by 18. Let’s say your reading is 4 mmol/L. Here’s the conversion:
4 mmol/L × 18 = 72 mg/dL
Quick Reference Guidelines
Remember, 100 mg/dL is the same as 5.6 mmol/L. This makes it easier to switch between units when checking your blood sugar.
Common Conversion Examples
- 80 mg/dL = 4.4 mmol/L
- 120 mg/dL = 6.7 mmol/L
- 3.5 mmol/L = 63 mg/dL
- 7.0 mmol/L = 126 mg/dL
Knowing these formulas and examples helps you understand your blood sugar readings. This knowledge is key to managing your diabetes well.
Normal Blood Sugar Ranges Across Age Groups
Keeping blood sugar levels healthy is key for feeling good. It’s especially important for people with diabetes. Knowing the right blood sugar range for your age helps you manage your diabetes better.
Adults without diabetes usually have fasting blood sugar under 100 mg/dL. But, people with diabetes aim for 70 to 180 mg/dL.
| Age Group | Normal Fasting Blood Sugar Range |
|---|---|
| Children under 6 years | 100 to 180 mg/dL (5.6 to 10.0 mmol/L) |
| Adolescents (13-19 years) | 90 to 130 mg/dL (5.0 to 7.2 mmol/L) |
| Young Adults (20-39 years) | 90 to 130 mg/dL (5.0 to 7.2 mmol/L) |
| Seniors (60 years and older) | 90 to 130 mg/dL (5.0 to 7.2 mmol/L) |
These ranges are just guidelines. Your doctor might suggest different targets for you. Checking your blood sugar often helps you stay on track and avoid problems.
Keeping blood sugar in check is vital for diabetes management. It helps prevent serious health issues like eye, kidney, and nerve damage. By knowing your age group’s normal range, you can work with your doctor to create a plan that meets your health needs.
Understanding Fasting Blood Glucose Levels
Keeping your blood glucose level healthy is key for managing diabetes. It helps avoid serious health problems. Knowing the right fasting blood sugar ranges is important for your body’s health.
Optimal Fasting Ranges
Adults without diabetes should aim for fasting blood sugar of 70-99 mg/dL. This is between 3.9-5.5 mmol/L. If it’s 100-125 mg/dL, you might have prediabetes. A reading of 126 mg/dL or higher means you likely have type 2 diabetes.
Risk Factors for Elevated Levels
Many things can raise your fasting blood glucose. These include your genes, not moving enough, and insulin resistance. Eating well and staying active can help keep your blood sugar in check.
When to Seek Medical Attention
If your fasting blood glucose is always over 126 mg/dL, see a doctor. Also, watch for signs like too much thirst, needing to pee a lot, or blurry vision. Your doctor can find out why and help you fix it.
Knowing your fasting blood glucose levels is crucial. By keeping them in the healthy range, you can manage your blood glucose levels better. This lowers your risk of diabetes management tools and boosts your health tracking charts.
Post-Meal Blood Sugar Targets
Keeping blood glucose levels healthy after meals is key for people with diabetes. The American Diabetes Association (ADA) says to keep blood sugar under 180 mg/dL (10 mmol/L) one to two hours after eating. Pregnant women with diabetes should aim for 110-140 mg/dL (6.1-7.8 mmol/L) one hour after meals and 100-120 mg/dL (5.6-6.7 mmol/L) two hours after.
If you don’t have diabetes, try to keep blood sugar under 140 mg/dL (7.8 mmol/L) two hours after eating. This follows the glycemic index references and carb counting resources for better food choices.
“Maintaining healthy post-meal blood sugar levels is a key component of effective diabetes management and overall well-being.”
These are general guidelines. Your targets might be different based on your age, diabetes status, and health. Always talk to your healthcare provider to find the best blood sugar ranges for you.

Understanding your post-meal blood glucose levels and making lifestyle changes can help manage your health. It can also lower the risk of diabetes-related problems.
Special Considerations for Blood Sugar Monitoring
Managing your blood glucose levels is important. There are things to think about besides just fasting and post-meal readings. Keeping them under control is key to avoid problems like gestational diabetes. Women should try to keep their fasting levels between 70-95 mg/dL. They should also aim for 1-hour post-meal levels of 110-140 mg/dL.
Impact of Exercise on Readings
Exercise can lower your blood sugar levels for up to 24 hours. This means you might need to change how much insulin you take or how many carbs you eat. This helps avoid low blood sugar.
Medication Effects
Some medicines can change your blood sugar levels. For example, corticosteroids can make them go up. But medicines like metformin can make them go down. Always talk to your doctor if you change your medicines.
Knowing about these special things can help you manage your blood sugar better. This way, you can make choices that are good for your health and well-being.
Using Technology for Blood Sugar Tracking
In today’s world, there are many tools to help manage diabetes and track blood sugar. You can use continuous glucose monitors (CGMs) or apps on your phone. These tools change how people with diabetes track their glucose measurement units and use health tracking charts and diabetes management tools.
CGMs give you real-time glucose readings. This helps you see how your body reacts to food, exercise, and medicine. They show you how your blood sugar changes all day. This helps you spot patterns and make better choices for your diabetes management.
Many health tracking charts and apps work with your glucose meter or CGM. They give you detailed reports and trends over time. These tools are great for spotting changes in your blood sugar levels. They help you stay on top of your glucose measurement units.
“Using a CGM has been a game-changer for me. I can see how my body reacts to different foods and activities, which has really helped me improve my diabetes management.”
Technology lets you understand your blood sugar patterns better. It helps you make smart choices for your diabetes management tools. With the right health tracking charts and tools, you can control your glucose measurement units. This way, you can live a healthier, more balanced life.

The Role of A1C in Blood Sugar Monitoring
The A1C test is key for managing blood glucose levels. It shows your blood sugar average over 2-3 months. This helps you understand your diabetes management better. Knowing A1C percentages and how to convert them is important for tracking your health.
Understanding A1C Percentages
A normal A1C is below 5.7%. A level of 5.7% to 6.4% might mean you have prediabetes. If it’s 6.5% or higher, you have diabetes.
For people with diabetes, the goal A1C levels vary. They depend on age, health, treatment, and other factors.
Converting A1C to Average Blood Sugar
To find your estimated average glucose (eAG), use this formula: eAG (mg/dL) = (28.7 × A1C) – 46.7. For example, an A1C of 7% is about 154 mg/dL. This helps you understand your blood glucose levels better.
Keeping your A1C levels healthy is crucial. It lowers the risk of serious problems like nerve damage, eye issues, kidney disease, and heart problems. Work with your doctor to keep your A1C and blood sugar in check.
“Maintaining your A1C within the target range can be a game-changer in managing your diabetes and preventing serious complications.”
Interpreting Your Blood Sugar Data
Tracking your blood glucose levels is key to managing diabetes. But it’s even more important to understand what your data means. This helps you make smart choices for your health.
Look for patterns in your blood sugar readings. These can show how your body reacts to different things. For example, stress or changes in your diet. Try to keep your levels in a good range most of the time.
Your data can guide you in making changes to your diet and exercise. Talk to your doctor to review your readings. Together, you can find the right balance for your blood glucose levels, health tracking charts, and diabetes management tools.
Regular checks and self-care are crucial for managing diabetes. By using your blood sugar data wisely, you can actively manage your diabetes management. This leads to better health overall.
“Interpreting your blood sugar data is like solving a puzzle – the more you understand the patterns, the better you can manage your diabetes.”
Conclusion
The blood sugar conversion chart is key for easier glucose readings. It helps you manage your diabetes better. Knowing how to read your numbers is important.
Using new tech and understanding your data can improve your health. This is true for both fasting and after-meal blood sugar levels.
Having a plan just for you is very important. Talk to your doctors to get the right tools. This way, you can handle your blood sugar well.
With the right tools and knowledge, you can do great things. You can use blood sugar conversion charts, diabetes management tools, and health tracking charts to reach your health goals.
Starting your health journey is all about understanding numbers. Take action with the help of data. This will help you keep your blood sugar in check and improve your health.


A Life-Changing Experience with This Weight Loss Supplement (Nagano Tonic)
I’ve always struggled with finding a weight loss solution that actually works for me. Like many, I’ve tried numerous diets, exercise routines, and supplements over the years—some worked for a short time, but nothing ever gave me long-term results. That was until I decided to try the weight loss supplement I found : Link to the Supplement.
From the moment I started using it, I noticed a difference. Not only did I feel more energized, but my cravings also became more manageable. The best part? I started seeing results much quicker than I anticipated! Over the course of just a few weeks, I noticed a significant reduction in belly fat and overall weight loss that I hadn’t been able to achieve before.
What makes this supplement stand out from all the others I’ve tried is how it supports me in my daily routine without any jitters or energy crashes. I’m able to stay focused and motivated, which has made it easier to stay on track with my diet and exercise plan.
This product truly exceeded my expectations, and I feel more confident and healthier than ever before. If you’re struggling with your weight loss journey like I was, I highly recommend giving this supplement a try. It’s been a game-changer for me, and I’m sure it can work wonders for you too!
Contant Them on email .. tonicnagano50@gmail.com
I’ve tried so many weight loss products over the years, but nothing worked like this supplement! Since I started using it, I’ve noticed a big difference in my energy levels and appetite control. In just a few weeks, I’ve lost weight and feel so much better. It’s been easy to stick with, and the results speak for themselves. Highly recommend this to anyone looking to make a real change!
wasn’t sure what to expect, but this weight loss supplement has really impressed me! After just a few weeks of use, I’ve already dropped a few pounds and feel more motivated to stay active. It’s helped curb my cravings and boosted my energy throughout the day. I’m excited to keep going and see even better results. Definitely worth trying!
Reach them on tonicnagano50@gmail.com
This Nagano Tonic has been amazing! In just a few weeks, I’ve lost weight, feel more energized, and my cravings are under control. Highly recommend it!
Thats the link to purchase http://surl.li/iasppy